
More than 80 percent of American companies rely on visual tools to manage projects, yet confusion around methods still slows teams down. Clarity in scheduling and task management is critical for meeting deadlines, whether you are leading a large American business or organizing a smaller project team. This guide breaks down the essentials of Gantt charts, explaining how these visual timelines can streamline complex projects and help both individuals and teams work smarter.
Table of Contents
- Defining Gantt Charts And Core Concepts
- Visualizing Project Timelines And Dependencies
- Key Benefits For Teams And Individuals
- Comparing Gantt Charts To Alternative Methods
- Common Pitfalls When Using Gantt Charts
Key Takeaways
| Point | Details |
|---|---|
| Gantt Charts Are Essential Tools | They provide a visual representation of project schedules, clarifying task durations and dependencies for effective project management. |
| Understanding Task Dependencies Is Crucial | Gantt charts help reveal critical interconnections between tasks, which is vital for timely project completion and identifying bottlenecks. |
| Facilitate Communication and Accountability | These charts promote a transparent workspace where team members can clearly see project scope, responsibilities, and potential conflicts. |
| Be Aware of Limitations | Relying solely on Gantt charts can lead to misconceptions about project predictability; they should be supplemented with other planning methods for robustness. |
Defining Gantt Charts and Core Concepts
A Gantt chart is a powerful visual project management tool designed to transform complex project timelines into clear, digestible schedules. Graphically representing project schedules, these charts help teams understand task duration, dependencies, and overall project progression at a single glance.
The fundamental structure of a Gantt chart involves two primary axes. The vertical axis lists specific project tasks or activities, while the horizontal axis represents time intervals. Each task is represented by a horizontal bar whose length indicates the task’s duration and placement shows its position within the overall project timeline. Modern Gantt charts have evolved beyond basic scheduling, now incorporating advanced features like task dependency tracking, resource allocation visualization, and real-time progress monitoring.
Originally developed by mechanical engineer Henry Gantt in the early 20th century, these charts were initially used in manufacturing and construction industries to improve workforce productivity and project scheduling. Project management tools like these help teams achieve several critical objectives:
- Visualize entire project timelines at a glance
- Identify potential scheduling conflicts
- Track task dependencies and interconnections
- Allocate resources more effectively
- Communicate project status transparently
Today, Gantt charts remain an indispensable tool for project managers across industries, enabling precise planning, efficient communication, and strategic project execution.
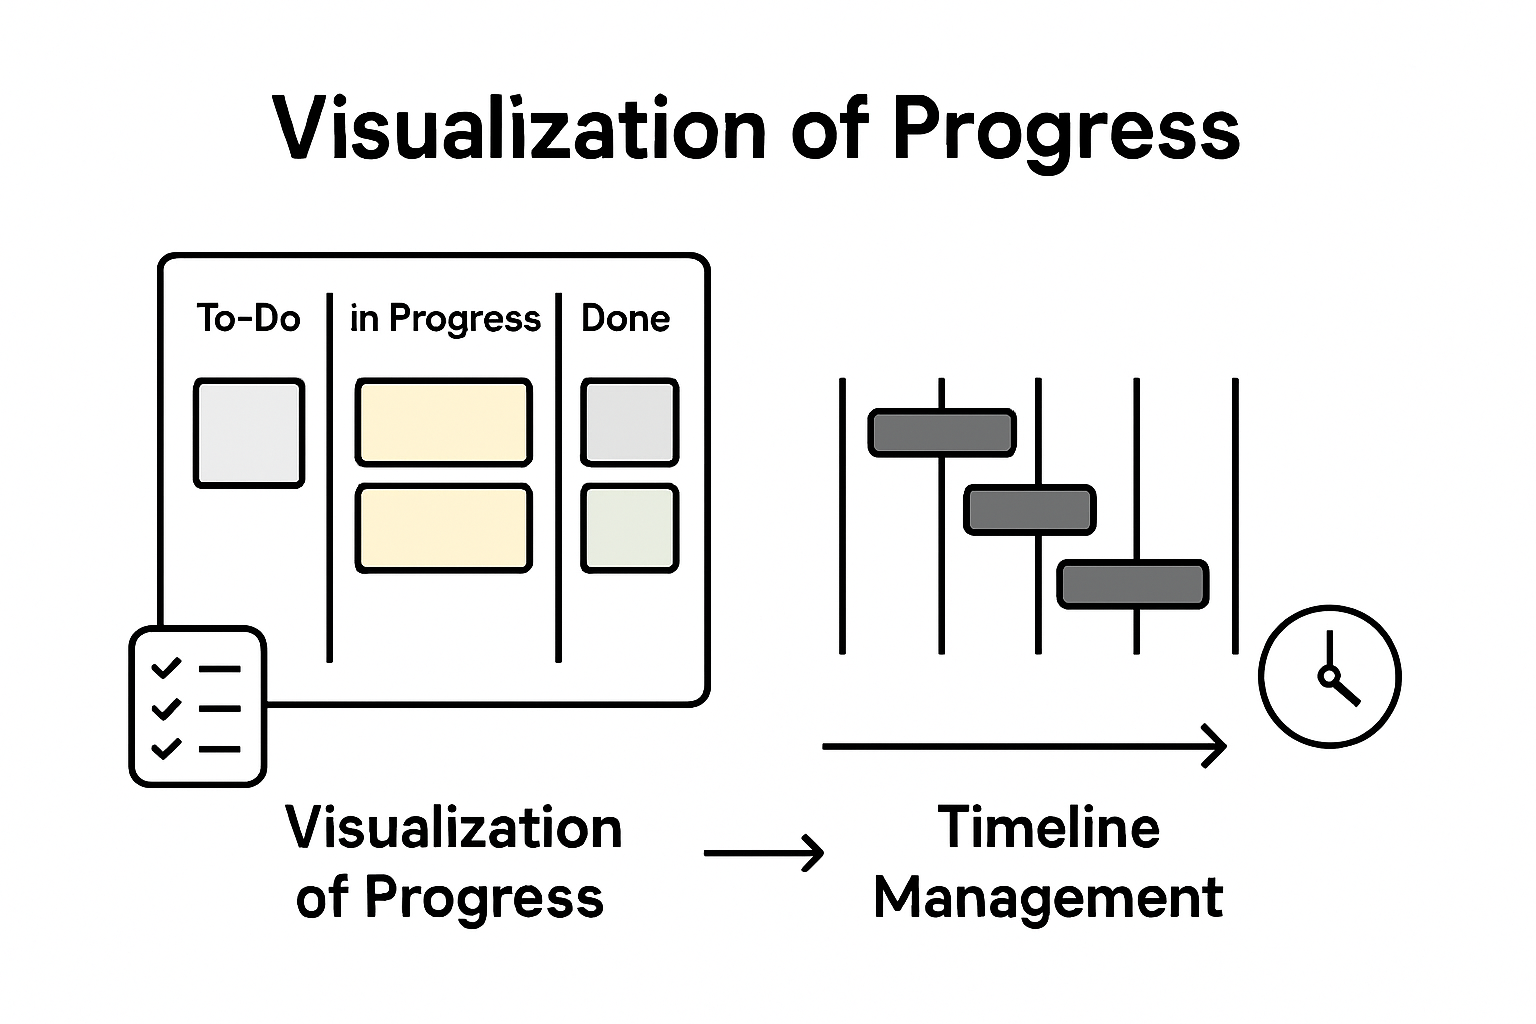
Visualizing Project Timelines and Dependencies
Effective project management hinges on understanding complex task relationships and schedules. Visualizing task dependencies and timelines transforms abstract project plans into clear, actionable roadmaps that enable teams to navigate intricate workflow challenges with precision.
Gantt charts excel at revealing the intricate web of task interconnections through sophisticated visual mechanisms. By displaying tasks as horizontal bars along a chronological axis, these charts illuminate not just individual task durations, but also critical relationships between different project components. Managers can instantly recognize which tasks must be completed before others can begin, identify potential bottlenecks, and understand the sequence of work required to drive project completion.
The Precedence Diagram Method provides additional depth to project visualization, using graphical representations to map out task sequences and interdependencies. Project scheduling techniques like these help teams understand complex workflow dynamics by:
- Highlighting sequential task relationships
- Identifying critical path activities
- Revealing potential scheduling constraints
- Showing parallel work opportunities
- Demonstrating resource allocation requirements
By translating complex project data into intuitive visual formats, Gantt charts and precedence diagrams empower project managers to make strategic decisions, optimize workflow efficiency, and maintain clear communication across teams.
Key Benefits for Teams and Individuals
Gantt charts deliver transformative advantages for both individual professionals and collaborative teams, revolutionizing how work gets planned and executed. Project management strategies that enhance team coordination provide clarity, reduce miscommunication, and create a shared understanding of project dynamics.

For individual professionals, Gantt charts serve as powerful personal productivity tools. They enable precise time management by breaking complex projects into manageable segments, allowing workers to visualize their workload, prioritize tasks, and track progress with unprecedented clarity. By presenting a comprehensive overview of project timelines, these charts help individuals identify potential time conflicts, allocate personal resources more strategically, and maintain a holistic view of their professional commitments.
Teams benefit equally dramatically from Gantt chart implementation. These visual tools create a transparent, unified workspace where every team member can instantly understand:
- Overall project scope and timeline
- Individual task responsibilities
- Critical path and interdependencies
- Potential scheduling conflicts
- Resource allocation requirements
Moreover, Gantt charts foster a culture of accountability and collaborative transparency. They transform abstract project plans into concrete, shareable roadmaps that align team efforts, minimize misunderstandings, and create a shared mental model of project progression. By providing a single source of truth, these charts eliminate ambiguity and empower teams to work more cohesively toward common objectives.
Comparing Gantt Charts to Alternative Methods
Project management methodologies offer diverse approaches to tracking and planning work, with each technique providing unique insights and capabilities. Project scheduling algorithms like the Critical Path Method demonstrate the sophisticated landscape of project planning tools, each designed to address specific organizational needs and complexity levels.
While Gantt charts excel at providing visual timelines and intuitive task representations, alternative methods like the Critical Path Method (CPM) and Precedence Diagram Method (PDM) offer complementary perspectives on project management. CPM focuses intensely on identifying the longest sequence of dependent tasks, pinpointing exactly which activities most directly impact project completion time. This approach differs significantly from Gantt charts by emphasizing mathematical precision over visual representation.
Each project management technique brings distinct advantages to the table. Diagramming methods for tracking project dependencies reveal the intricate connections between tasks through different visual languages:
- Gantt Charts: Time-based visual representation
- Critical Path Method: Mathematically precise task sequencing
- Precedence Diagram Method: Network-style dependency mapping
- Kanban Boards: Workflow state visualization
- PERT Charts: Probabilistic task duration estimation
Ultimately, the most effective project management approach depends on specific project requirements, team dynamics, and organizational complexity. Successful project managers often blend multiple techniques, leveraging the strengths of each method to create comprehensive, adaptable planning strategies.
Common Pitfalls When Using Gantt Charts
Project visualization tools like Gantt charts can become double-edged swords when implemented without careful consideration. Navigating complex project management challenges requires understanding potential limitations that can undermine even the most well-intentioned planning efforts.
One significant pitfall emerges when teams rely exclusively on Gantt charts without complementary planning techniques. These visual tools can create a false sense of precision, masking the inherent unpredictability of project work. Managers might mistake the chart’s structured appearance for guaranteed predictability, overlooking the dynamic nature of real-world task completion. This can lead to unrealistic expectations, rigid thinking, and decreased adaptability when inevitable project variations occur.
The most critical challenges in Gantt chart implementation include:
- Overcomplicating visual representations
- Failing to account for task interdependencies
- Neglecting resource constraints
- Assuming linear task progression
- Ignoring potential bottlenecks and risks
- Not updating charts regularly
- Misrepresenting actual task complexity
Successful project managers recognize that Gantt charts are powerful tools but not infallible solutions. They continuously validate visual representations against actual progress, remain flexible in their approach, and supplement Gantt charts with additional project management methodologies to create robust, adaptive planning strategies.
Transform Your Project Planning with Powerful Visualization and Prioritization Tools
Managing complex projects often leads to confusion when timelines and task dependencies are unclear. This article highlights how Gantt charts clarify project schedules and identify critical paths, but also points out common pitfalls like overcomplication and ignoring resource constraints. If you have ever struggled with balancing detailed project visuals alongside effective prioritization and accountability, you understand how crucial an integrated solution is.
TaskQuadrant.io bridges these challenges by combining clear project timeline visualization through interactive Gantt charts with a smart task prioritization system based on the Eisenhower Matrix. By simplifying task management and highlighting what is truly urgent and important, it helps individuals and teams avoid bottlenecks while maintaining focus on their highest-impact activities. Its intuitive interface means you can get started quickly without complex setup and easily monitor progress via visual dashboards.
Explore how TaskQuadrant.io can improve your project execution and personal productivity right now.
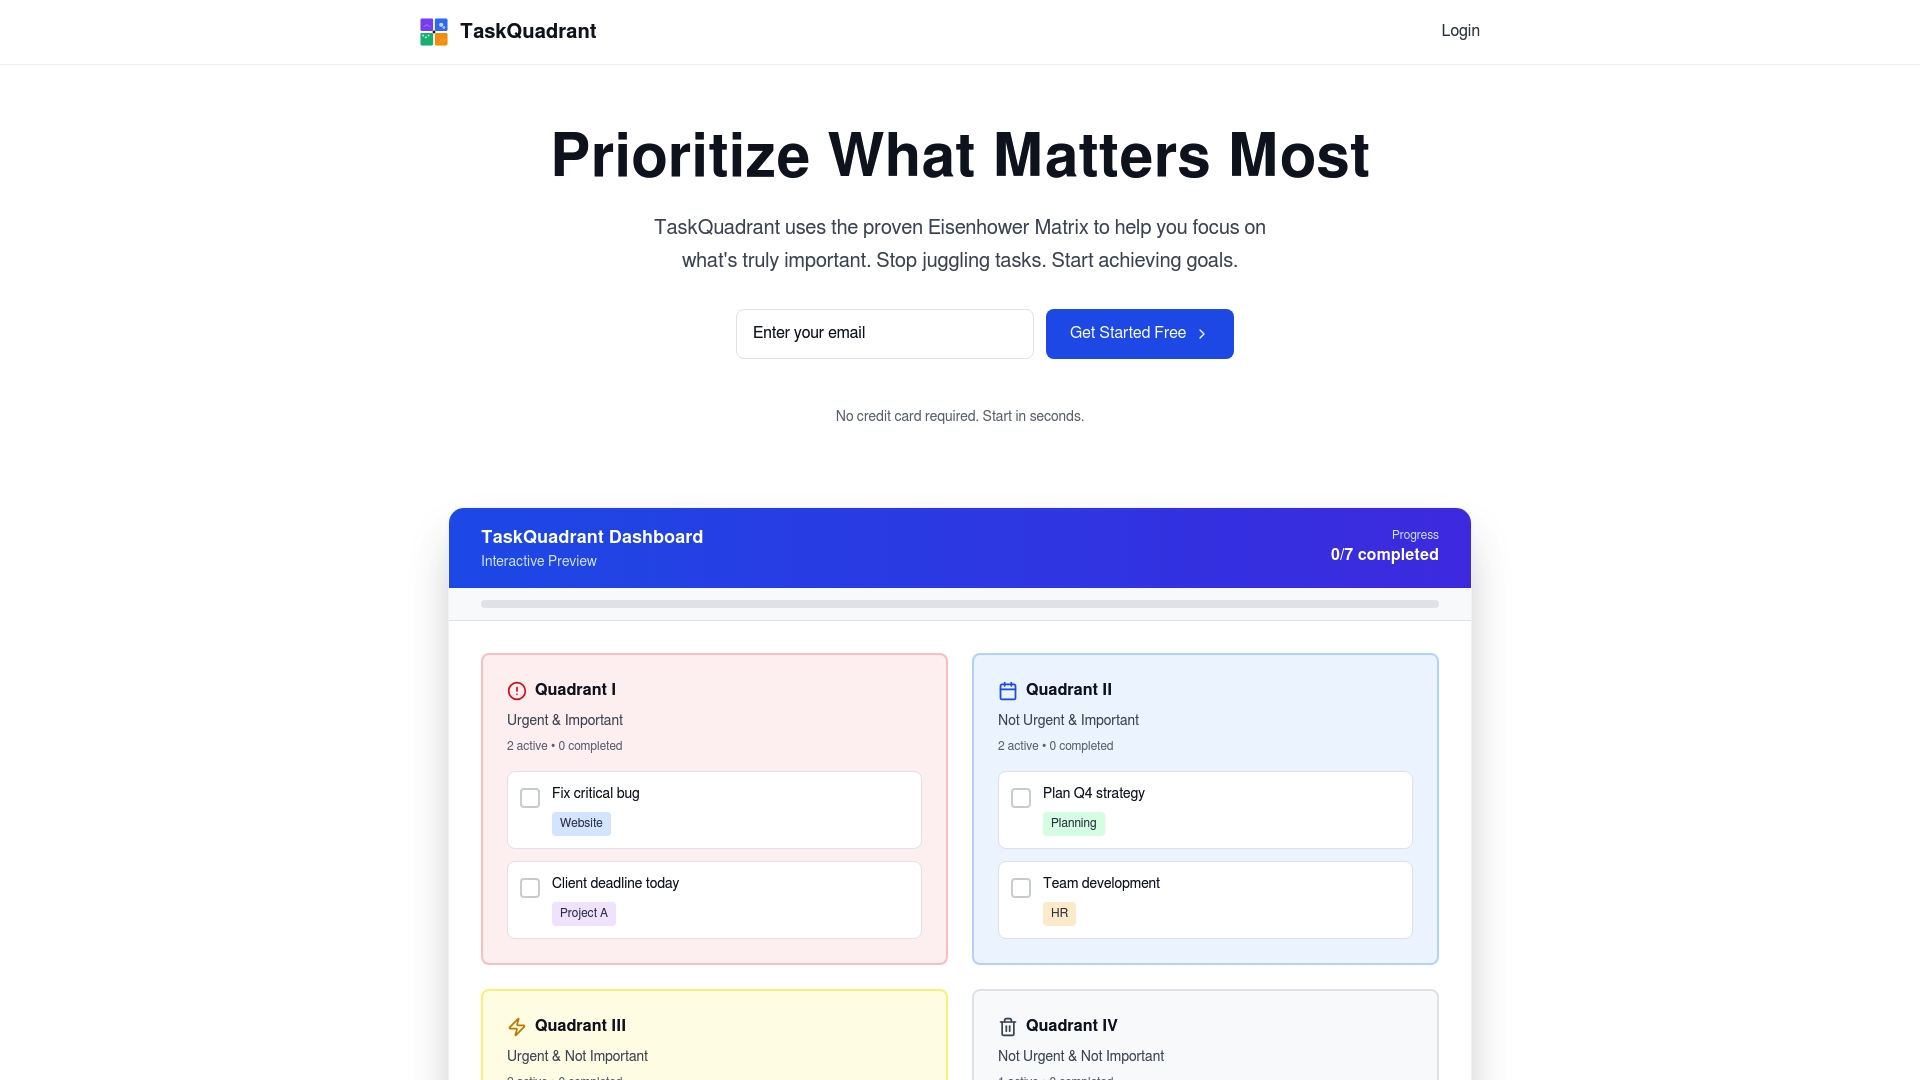
Stop letting confusing schedules and undefined priorities slow you down. Visit TaskQuadrant.io to organize your projects effectively, track goals clearly, and automate recurring work with ease. Start prioritizing like a pro and gain the confidence to tackle every task with clarity and control today.
Frequently Asked Questions
What is a Gantt chart and how is it used in project planning?
A Gantt chart is a visual project management tool that represents project schedules with tasks displayed as horizontal bars along a timeline. It helps teams understand task durations, dependencies, and overall project progression.
What are the key benefits of using Gantt charts for individual professionals?
Gantt charts enhance individual productivity by breaking complex projects into manageable tasks, allowing for better time management, prioritization, and tracking of progress.
How do Gantt charts compare to other project management methods?
Gantt charts focus on visualizing timelines and task durations, while methods like the Critical Path Method emphasize task sequencing and dependencies. Each method serves different purposes in project planning.
What common pitfalls should be avoided when using Gantt charts?
Common pitfalls include overcomplicating visuals, neglecting task interdependencies, and failing to update charts regularly. It’s important to use Gantt charts alongside other planning techniques for best results.
Recommended
- TaskQuadrant – Professional Task Management with Eisenhower Matrix
- TaskQuadrant Landing – Eisenhower Matrix Task Management
- TaskQuadrant Features – Eisenhower Matrix, Projects & Analytics
- Manpower Calculator – Estimate Project Resources & Hours
- Project Management Gantt Chart Template: Essential Guide – Optio Station: Best Project Management App for Prioritization
Leave a Reply